50+ customer self-service statistics (2026, sourced)
Customer self-service statistics, each traced to its primary source with year and sample: preference, resolution rates, where customers look, cost per contact, video and AI.
 Roozbeh Firoozmand17 min read

Updated November 3, 2026. Next review: February 2027.
Most customers try self-service first, but few finish there. Gartner found that 73% of customers use self-service during a service journey, yet only 14% of issues are fully resolved in it (2024). The most common reason: in 43% of cases, customers couldn't find relevant content. And 51% of service journeys now start on Google, YouTube or ChatGPT (Gartner, 2025).
Below are more than 50 customer self-service statistics, every one we could trace to a primary source, grouped by theme: preference, resolution, where customers look, cost, video and AI. Every number links to its primary source, with the publisher, the year and the sample where the source gives one. Vendor research is labeled.
Key customer self-service statistics at a glance
| Statistic | Source |
|---|---|
| 73% of customers use self-service at some point in their service journey | Gartner, 2024; 5,728 customers, Dec 2023 |
| Only 14% of customer service issues are fully resolved in self-service | Gartner, 2024; 5,728 customers, Dec 2023 |
| The most common reason self-service failed: in 43% of cases, customers couldn't find content relevant to their issue | Gartner, 2024; 5,728 customers, Dec 2023 |
| 51% of customer service journeys begin on third-party platforms such as Google, YouTube and ChatGPT | Gartner, 2025; 5,801 customers, Jan–Feb 2025 |
| Customers report an average 62% success rate finding what they need on platforms like YouTube or Google | Gartner, 2025; 5,801 customers, Jan–Feb 2025 |
| Only 22% of customers start, stay in and resolve their issue entirely through a company's own channels | Gartner, 2025; 5,801 customers, Jan–Feb 2025 |
| Customers are about three times more likely to use third-party GenAI tools than a company's chatbot for service issues | Gartner, 2026; 3,566 customers, Feb–Mar 2026 |
| Median cost per contact: $1.84 for self-service, $13.50 for assisted channels | Gartner, 2024; benchmark of organizations |
| 81% of customers try to take care of matters themselves before reaching a live representative | Harvard Business Review (CEB research), 2017 |
Do customers prefer self-service?
Most customers start with self-service, but stated preferences still favor the phone for anything complex.
- 81% of customers, across industries, attempt to take care of matters themselves before reaching out to a live representative. Source: Harvard Business Review, "Kick-Ass Customer Service", Dixon, Ponomareff, Turner and DeLisi, based on CEB research (2017); the article doesn't state a sample size.
- 73% of customers use self-service at some point in their customer service journey. Source: Gartner, survey of 5,728 customers, December 2023 (published 2024).
- 86% of consumers in the US, UK and Canada say they will explore self-service options before reaching out to support. Source: Five9 Customer Experience Report, 1,006 consumers (2025). Vendor survey.
- 56% of the same consumers still prefer phone support for general issues, rising to 74% for complex or urgent matters. Source: Five9 (2025). Vendor survey.
- 61% of customers would rather use self-service for simple issues. Source: Salesforce State of the Connected Customer (August 2023), as cited in Salesforce State of Service, 6th edition (2024). Vendor survey.
- 68% of customers would rather use self-service channels, like knowledge bases or customer portals, for simple questions or issues. Source: Salesforce State of the Connected Customer, 3rd edition, 8,022 consumers and business buyers in 16 markets (2019). Vendor survey.
- 90% of consumers in Brazil, Germany, Japan, the UK and the US expect brands and organizations to offer an online self-service portal. Source: Microsoft 2017 State of Global Customer Service Report, 5,000 consumers (2017). Vendor survey.
- 75% had used a search engine to find answers to service questions before calling an agent, and 74% had used a self-service support portal. Source: Microsoft (2017). Vendor survey.
- 57% of inbound calls came from customers who had gone to the company's website first. Source: Harvard Business Review, "Stop Trying to Delight Your Customers", Dixon, Freeman and Toman, based on CEB research (2010).
- In CEB's later presentation, 57.7% of phone callers had first gone to the company's website, and 35.5% were on the website while talking to a representative. Source: CEB, "The Effortless Experience", Matt Dixon (2016); sample not stated on the slide.
- 38% of Gen Z and millennial customers say they're likely to give up on a service issue if it can't be resolved in self-service, against 11% of baby boomers. Source: Gartner, 6,138 customers, December 2022 (published 2023).
- In a survey of 8,398 customers (published 2019), phone was the most preferred channel for resolving issues (44%), ahead of chat (17%), email (15%), the company website (12%) and search engines (4%). Source: Gartner (2019).
How often does self-service resolve the issue?
These are the help center and knowledge base statistics that matter most: how often self-service works, and why it fails. In each of the three Gartner surveys we found (2019, 2020, 2024), well under a fifth of customers or issues were fully resolved in self-service.
- Only 14% of customer service and support issues are fully resolved in self-service. Source: Gartner, 5,728 customers (2024).
- Even for issues customers describe as "very simple", only 36% resolve fully in self-service. Source: Gartner (2024).
- The most common reason self-service failed: in 43% of cases, customers couldn't find content relevant to their issue. Source: Gartner (2024).
- 88% of customer service journeys that start in self-service touch multiple channels, including phone, live chat and email. Source: Gartner, 6,138 customers (2023).
- 45% of customers who started in self-service said the company didn't understand what they were trying to do. Source: Gartner (2024).
- Earlier Gartner surveys found 9% of customers resolved their issues completely via self-service in 2019 (Gartner, 2019) and 13% found resolution wholly within self-service in 2020, in a survey of more than 6,000 customers (Gartner, 2020). The surveys used different samples, and the 2024 figure counts issues rather than customers, so treat this as a direction, not a trend line.
- Only 22% of customers start, stay in and resolve their issue entirely through a company's own channels. Source: Gartner, 5,801 customers (2025).
- 60% of customer service agents fail to promote self-service options, as reported by customers. Source: Gartner, 5,801 customers (2025).
- When agents do promote self-service, the number of customers likely to use it next time roughly doubles. Gartner reports this as an association, not a cause. Source: Gartner (2025).
- When customers can't resolve an issue on their own, over half say it's because there is too little information online. Source: Microsoft (2017). Vendor survey.
Where do customers look for answers?
Increasingly not on your website: search engines, YouTube and AI assistants come first.
- 51% of customer service journeys now begin on third-party platforms such as Google, YouTube and ChatGPT, with search engines the most popular starting point. Source: Gartner, 5,801 customers, January–February 2025 (2025).
- 74% of Gen Z customers start their service journey with a third party before reaching an official company channel. Source: Gartner (2025).
- Customers report an average 62% success rate finding what they need on platforms like YouTube or Google. Source: Gartner (2025).
- Gartner predicts that by 2027, 40% of all customer service issues will be fully resolved by unofficial third-party tools powered by GenAI. A prediction, not a measurement. Source: Gartner (2024).
What does self-service cost compared with live support?
- The median cost per contact is $1.84 for self-service and $13.50 for assisted channels; phone, chat and email tend to cost about the same. Source: Gartner, "Benchmarks to Assess Your Customer Service Costs", February 2024 (a benchmark of organizations, not customers; full report for Gartner clients).
- Median customer service and support spending is 0.7% of company revenue a year. Source: Gartner (2024).
- Gartner's 2019 poll of customer service and support leaders put live channels at an average of $8.01 per contact and self-service at about $0.10. Source: Gartner (2019). It's an average from a different poll, so don't compare it with the 2024 medians; it's often quoted without its date.
Do people prefer video or text for instructions?
The strongest non-vendor signal is Gartner's: customers report a 62% success rate finding what they need on platforms like YouTube or Google (2025). The rest of the evidence on video comes from vendor research.
- 83% of people prefer to consume instructional or informational content by watching a video, ahead of text (41%), images (40%), in person (36%) and audio (30%); respondents could pick several. Source: TechSmith Video Viewer Trends 2024, 929 people in six countries (2024). Vendor survey.
- 87% of viewers prefer a real person to an animated character or AI avatar in instructional videos. Source: TechSmith (2024). Vendor survey.
- In a controlled test with 125 office workers, 67% performed tasks better when instructions were given visually rather than as text alone, and they absorbed the information 7% faster. Source: TechSmith, "The Value of Visuals", research by Dr. Alastair Goode (2018). Vendor study.
- Nielsen Norman Group's usability research found that, when budget allows, it's best to include both text and video for informational content: people ignore the video when they don't need it and use it when they do (NN/g, 2020). Qualitative research.
- 79% of test users always scanned a new web page; only 16% read word by word. Source: Nielsen Norman Group (1997). An old study, but still the standard reference for why help articles need to be skimmable.
How are AI answers and chatbots changing self-service?
- Customers are about three times more likely to use third-party GenAI tools than company-provided chatbots for customer service, and use of company chatbots has stayed statistically unchanged since 2022. Source: Gartner, 3,566 B2B and B2C customers, February–March 2026 (2026).
- 49% of customers would have been willing to use a chatbot if the company had provided one, but only 7% used a chatbot or digital assistant in their most recent service interaction. Source: Gartner, 3,566 customers (2026).
- Only 27% of customers would try a chatbot again after a negative experience. Source: Gartner (2026).
- 87% of customers say it's essential for companies using GenAI in customer service to offer an option to reach a human agent. Source: Gartner, 3,566 customers (2026).
- 50% of customers say their interactions are easier when companies use GenAI. Source: Gartner (2026).
- 64% of customers would prefer that companies didn't use AI for customer service, and 53% would consider switching to a competitor if they found out a company was going to. Source: Gartner, 5,728 customers (2024).
- 72% of customers won't reuse a company's chatbot after just one negative experience. Source: Salesforce State of the Connected Customer (August 2023), as cited in Salesforce State of Service, 6th edition (2024). Vendor survey.
- 74% of consumers say that, because of AI, they now expect customer service to be available 24/7. Source: Zendesk CX Trends 2026, 6,182 consumers and 5,115 CX leaders and agents in 22 countries (published November 2025). Vendor survey.
- 59% of consumers prefer an instant AI chatbot to waiting for a live agent, and 72% are open to AI-powered interactions if they can escalate to a human. Source: Five9, 1,006 consumers (2025). Vendor survey.
- Service teams estimate 30% of cases are handled by AI today and expect 50% by 2027. These are estimates by service professionals, not measurements. Source: Salesforce State of Service, 7th edition, 6,500 service professionals in 40 countries (2025). Vendor survey.
- 91% of customer service and support leaders report pressure from executive leadership to implement AI in 2026. Source: Gartner, 321 service leaders (2026).
- 58% of service leaders aim to upskill agents into knowledge management specialists. Source: Gartner (2026).
- Gartner predicts that by 2029, agentic AI will autonomously resolve 80% of common customer service issues without human intervention. A prediction. Source: Gartner (2025).
- When Google showed an AI summary, users clicked a traditional search result on 8% of visits, against 15% when it didn't, and clicked a link inside the summary on about 1%. Google disputes the method. Source: Pew Research Center, browsing data from 900 US adults (2025).
- When an AI Overview appears, the top-ranking page gets a 58% lower average click-through rate. Source: Ahrefs, 300,000 keywords, December 2025 vs December 2023 (2026). Vendor data study; correlation only.
- About half of US adults (49%) now use AI chatbots, up from a third in 2024. Source: Pew Research Center, 5,119 US adults (2026).
Can employees find what they need internally?
- 47% of digital workers struggle to find the information or data they need to do their jobs effectively. Source: Gartner Digital Worker Survey, 4,861 employees (2023).
- The average knowledge worker uses 11 applications at work, up from six in 2019. Source: Gartner (2023).
Which popular self-service statistics can't be traced?
These numbers appear on many statistics pages. We looked for the original source of each. Where we couldn't open one, we left the number off this page. If you know the primary source, tell us and we'll add it.
| Often quoted | What we found (as of November 3, 2026) |
|---|---|
| "67% of customers prefer self-service over speaking to a company representative" (usually credited to Zendesk or Nuance) | We couldn't find it in any Zendesk or Nuance report or release we could access, and the pages that quote it don't link a source. |
| "91% would use a knowledge base if it were tailored to their needs" (usually credited to Aspect) | Not in Aspect's Consumer Experience Index releases (2018, 2020) that we could find. |
| "70% of customers expect a company website to include a self-service application" (usually credited to Zendesk) | We found no Zendesk source. The earliest source we found is a 2015 Microsoft Dynamics infographic, which cites a Parature report we couldn't open. Microsoft's 2017 report asks a similar question (90%, above). |
| "90% expect a self-service portal" dated 2025 | Traceable, but the figure is from Microsoft's 2017 report, not 2025. |
How we compiled these statistics
- Primary sources only. Every number was checked on the publisher's own page, press release or report PDF on November 3, 2026, not on a roundup. Where a figure appears only in a paywalled report, we say so.
- Year and sample. Each line gives the publication year and, where the source states it, the sample size and countries. Fieldwork can be months earlier than publication.
- Labels. Gartner and CEB are analyst firms (CEB has been part of Gartner since 2017; its research appears here through Harvard Business Review articles and CEB's own presentation). Pew Research Center is an independent research organization; Nielsen Norman Group is a UX research and consulting firm. Figures from companies that sell customer service, AI or video software (Zendesk, Salesforce, Five9, Microsoft, TechSmith, Ahrefs) are labeled "vendor survey" or "vendor study". Predictions are labeled as predictions.
- Not comparable across surveys. Different surveys ask different questions of different people. Compare a number with its own earlier editions, not with another publisher's.
- No Clevera data. This page contains no figures from Clevera's own product.
- Updates. We review this page every quarter and replace figures when a newer edition of the same study is published. Spotted an error or a newer source? Email support@clevera.ai.
To cite this page: "Customer self-service statistics (2026)", Clevera, updated November 3, 2026, https://www.clevera.ai/blog/customer-self-service-statistics. Please link to the primary source for any single statistic.
What do these numbers mean for your help center?
Three patterns run through the data. People try self-service first but rarely finish there (14% fully resolved). The most common reason is missing or unfindable content (in 43% of cases, customers couldn't find relevant content), and stale content is part of that: see how to keep documentation up to date. And answers increasingly reach customers through search engines, YouTube and AI assistants rather than through your own site, which is why it pays to make your documentation AI-ready.
Clevera is an AI platform that turns a screen recording into a narrated how-to video, a step-by-step help article and a page on your hosted help center, in 74 languages. It's built for the content-coverage problem in that data:
- Fill the gaps you can see. Your help center lists searches that found nothing, each with a Write article button (how insights are counted). Record the task once, and Clevera writes the article with screenshots and can make the matching how-to video.
- Be readable where people ask. Every help center page is prerendered, listed in a sitemap and an
llms.txtfile, and served as Markdown too, so search engines and AI assistants can read it. Readers can also ask the help center's Ask AI assistant, which answers from your pages and shows its sources. - Keep it current. When you edit a video, every share link, embed and help-center page that shows it plays the new version (LiveSync). On Pro and Custom, Autopilot drafts updated articles and videos when you ship, for you to approve.
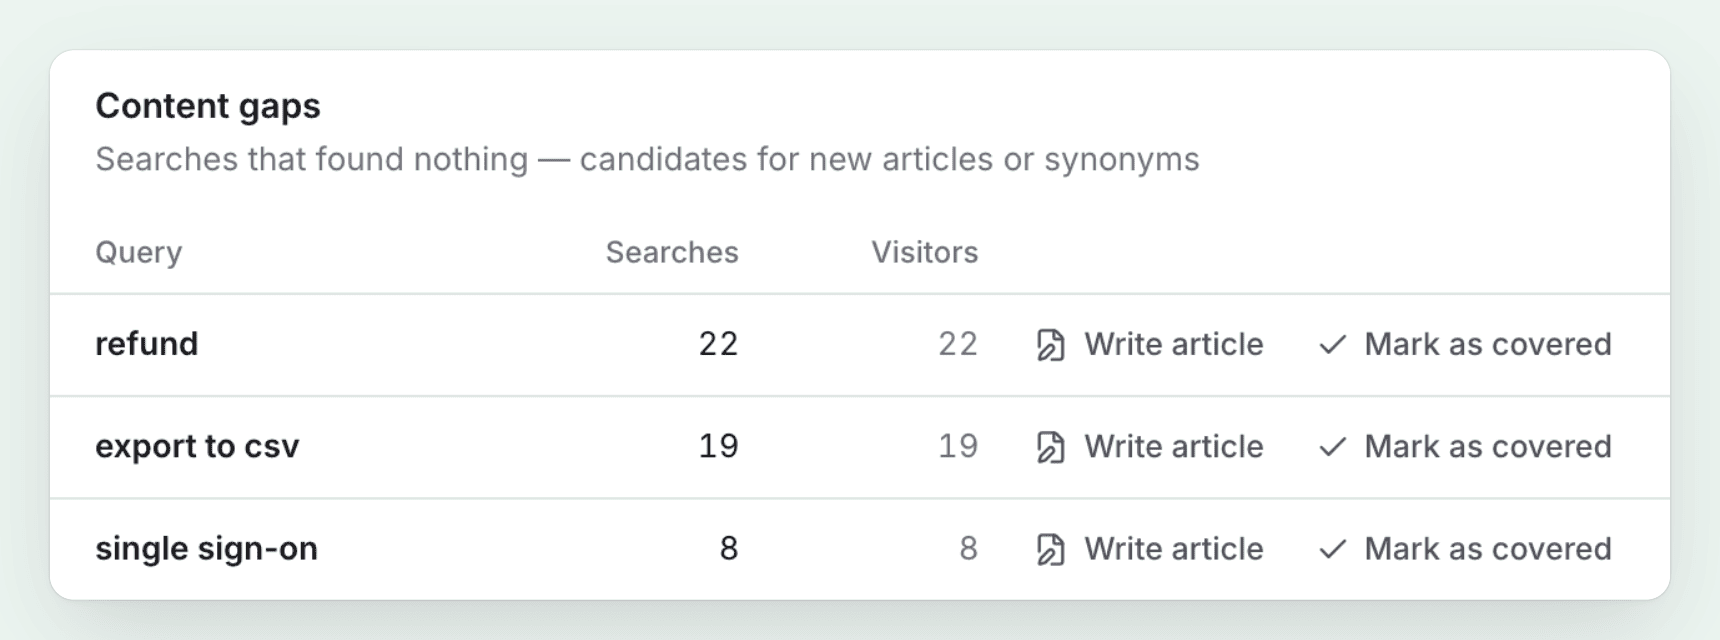
The hosted help center is included on every plan, Free included; your own domain starts on Starter at $29 a month billed yearly (as of November 3, 2026; see pricing). Start free or see Clevera's help center software.
FAQ
What percentage of customers prefer self-service? It depends on the question asked. 81% of customers try to solve an issue themselves before contacting a representative (HBR/CEB, 2017), and 61% would rather use self-service for simple issues (Salesforce vendor survey, 2023 data). For complex or urgent issues, 74% still prefer the phone (Five9 vendor survey, 2025).
What is the self-service resolution rate? In Gartner's 2024 survey of 5,728 customers, only 14% of customer service issues were fully resolved in self-service. Even for issues customers called "very simple", only 36% were.
Why does self-service fail? The most common reason in Gartner's 2024 survey: in 43% of cases, customers couldn't find content relevant to their issue. In the same survey, 45% of customers who started in self-service said the company didn't understand what they were trying to do.
How much cheaper is self-service than live support? Gartner's February 2024 benchmark of organizations puts the median cost at $1.84 per self-service contact and $13.50 per assisted contact (phone, chat or email).
Do customers use AI chatbots for customer service? More through third-party tools than company bots. Gartner found customers are about three times more likely to use tools like ChatGPT than a company's chatbot, and only 7% used a chatbot or digital assistant in their most recent service interaction (Gartner, 2026).
Where do customers start when they need help? More than half (51%) of customer service journeys begin on third-party platforms such as Google, YouTube and ChatGPT, according to Gartner's 2025 survey of 5,801 customers.